Social Media Listening
Social media listening refers precisely to the Social listening conducted exclusively on social media, thus omitting other internet sources.
Within the context of popAI, the Centre for Research & Technology (CERTH) has conducted a social media listening activity, thus complementing the work carried out on the internet by ECAS colleagues.
In this light, the opinions and emotions of European citizens towards AI tools in Law Enforcement and safeguarding privacy and fundamental rights have been analysed. The most recent posts on Twitter related to this topic were extracted and sentiment analysis has been applied accordingly, through Natural Language Processing and computational techniques that analyse natural language and speech.
What is Sentiment Analysis and why it is important?
The automatic method of categorising text data into positive, negative, and neutral categories is called Sentiment Analysis. Sentiment Analysis uses machine learning to automatically identify how people are talking about a given topic. The most common use of sentiment analysis is detecting the polarity of text data that is automatically identifying if a tweet, product review or support ticket is talking positively, negatively, or neutrally about something.
Methodology
In the context of the popAI social media listening, the following procedure was followed:
- Compilation of a set of data from Twitter following keywords regarding citizen attitude towards controversies.
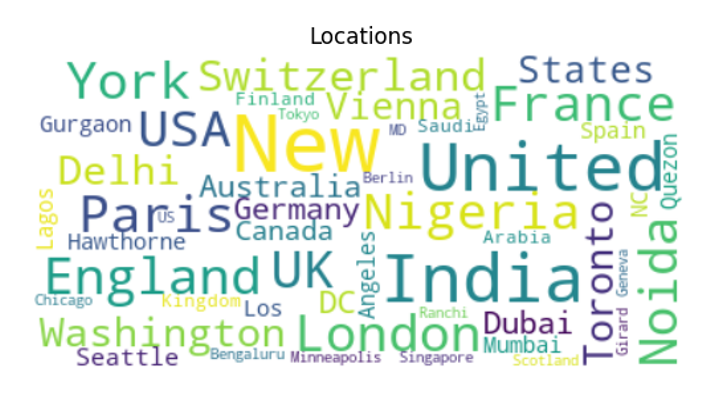
- Cleaning of data in order to use only those that presented European locations.
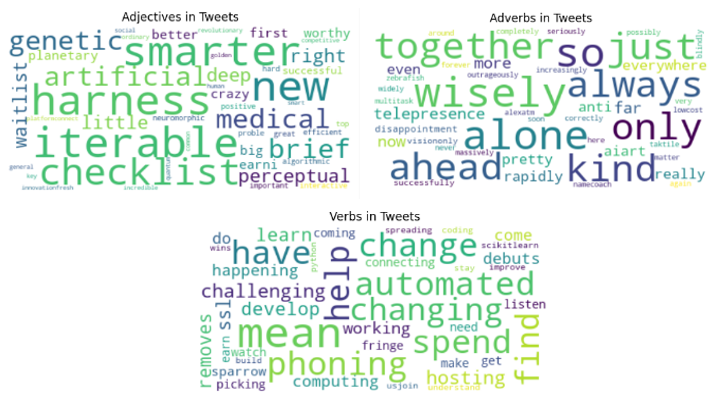
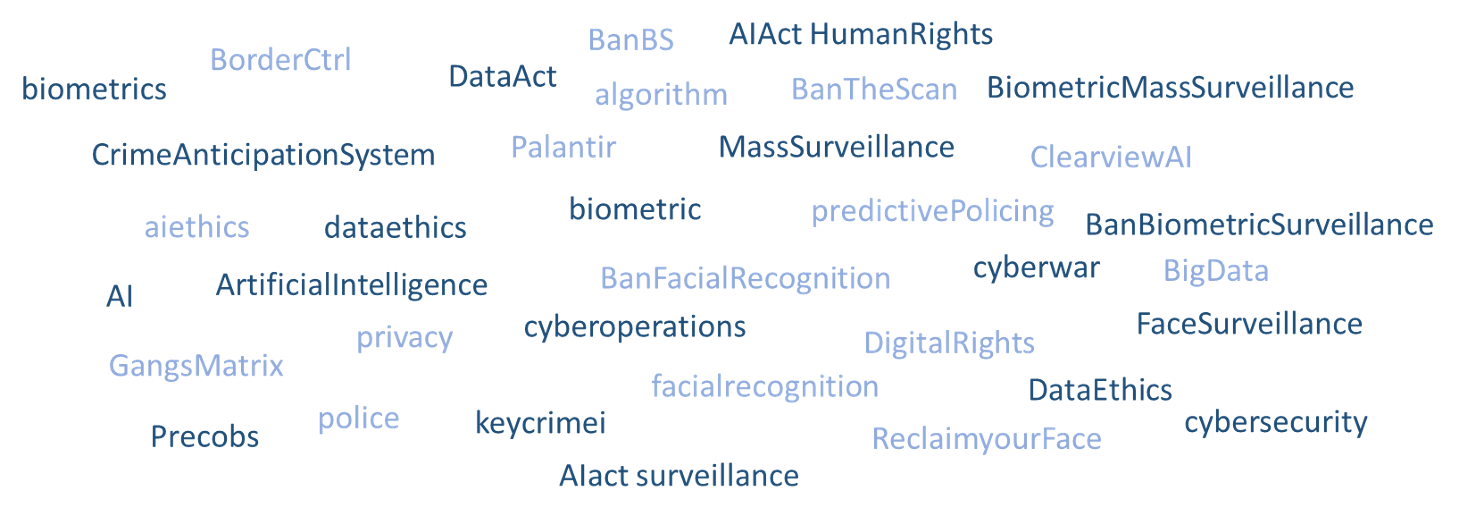
- Carrying out sentiment analysis for Europe and presenting NLP results on the most commonly occurring words on tweets to add more context on what people think and how they express themselves.
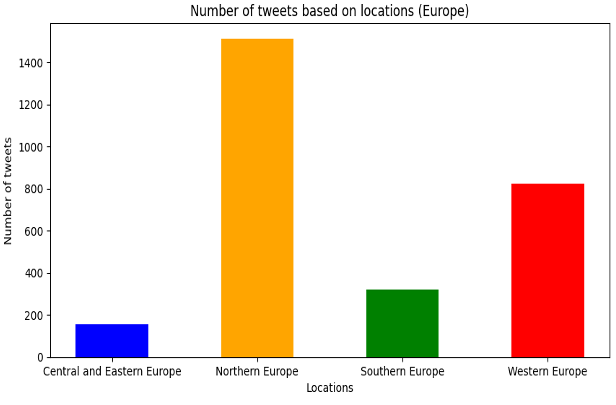
- Reinforcement of the above with NLP and conducting Sentiment analysis for 4 regions of Europe.
Data was obtained via API (Application Programme Interface) from social media, with Twitter being the most favourable platform for this collection.

Twitter is a free social networking site, where users broadcast short posts known as tweets. These tweets can contain text, videos, photos, or links. There is also the option for users to use hashtags in their tweets. Every hashtag on a tweet is a short string following a # and it becomes linked to all of the other tweets that include it. The function of hashtags was created on Twitter to add context and to also allow people to follow topics in a convenient and user-friendly manner that they are interested in.
Data from the most recent tweets related to the topic were gathered. The tweets were posted by more than 80.000 users to record their interaction activity. This process included programming in Python, performing Natural Language Processing to extract the information from the tweets and finally visualisation of the results.
To gather the data that focused the topic, a list of keywords that were presented on a previous task of popAI project was used as “Hashtags containing keywords, phrases names of companies and names of technologies”:
Results
The result was a dataset consisting of 172.939 rows of tweets and 17 features posted by 86.568 unique users. The dataset’s features included author’s ID, tweet’s full text, the number of hashtags, the number of retweets and 5 features for URL, image URL, video URL, location and hashtags in case the tweet included some of them. It also had a feature for sentiment and reliability which were both extracted by 2 extra algorithms applied on tweets.
With the intention of the sentiment analysis, the results came mainly from the authors’ ID feature, tweets’ full texts and the features of sentiment and location, as only 20% of the tweets included hashtags, 5% of them were labeled as “reliable” and there were no retweets.
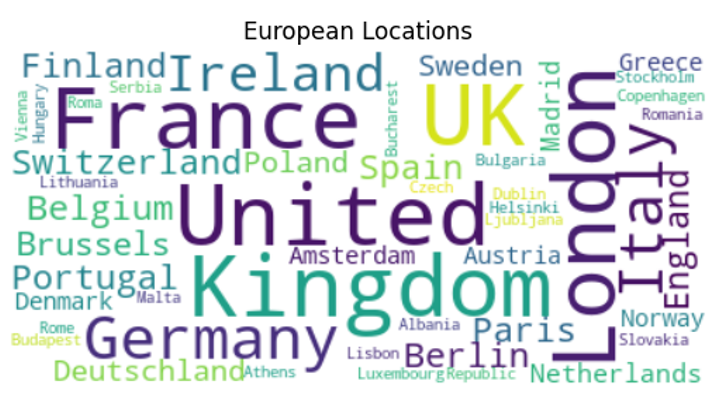
Following that, Python’s NLP (Natural Language Processing) algorithms on the dataset were applied, using Spacy pre-trained models to tokenize the locations that users declared on Twitter to find the real ones as many people used fake information in locations’ features and then filtered them to focus on the specific region Europe. Then, the locations were divided into 4 parts of Europe and we ended up with 2.816 tweets from 4 European regions.
Finally, Python’s library Matplotlib was used to visualize the results into pie charts, bar plots, and word clouds.
In the context of popAI, a public conversation on Twitter about the use of Artificial Intelligence tools in the delicate field of law enforcement, safeguarding privacy and fundamental rights has been investigated.
Close attention has been paid to European citizens’ sentiment on the topic to increase the accuracy and efficiency of its future results.
Sentiment analysis was implemented by Natural Language Processing and the results indicated large differences in terms of opinions – and related expressions of them – between different parts of Europe.
Sentiment analysis of Tweets
More than 2800 tweets from Europe were examined for sentiment analysis. On a scale of -2 to 2, sentiment ranges from extremely negative (-2) to extremely positive (2). After the calculations, half of the population presented a mixed impression of the role of AI in security, while the other half expressed both positive and negative views.
More specifically, nearly half of the tweets (41%) had neutral thoughts regarding AI in security systems, compared to 32.8% who were in favor of it, 4.5% who were extremely in favor of it, 17.7% who were against it, and 4% who were really against it.
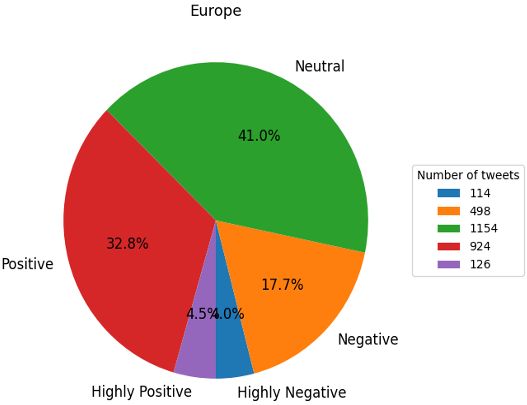
This pie chart shows the results of Sentiment Analysis of 2.816 tweets from Europe. This research reveals a sizable number of opposing views, both positive and negative, leading to the conclusion that societal opinion is not homogenised. Although, as the most considerable portion of people had a neutral opinion of AI in security systems, it emphasised the need of increasing the interest of people on the subject and focus on the benefits of AI tools to illustrate their effectiveness.